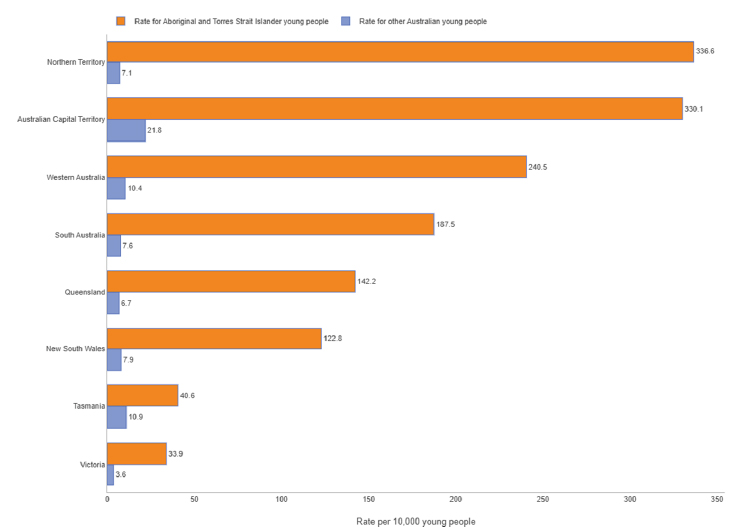
In 2023–24, the rate of youth detention for Aboriginal and Torres Strait Islander young people aged 10 to 17 years was higher than the rate for other Australian young people in all Australian states and territories. In Victoria, the rate for Aboriginal and Torres Strait Islander young people in 2023–24 was 33.9 per 10,000 young people, down from 51.0 per 10,000 young people in 2022–23. That rate was still 9.4 times the rate for other Australian young people.
Note: Data is based on the count of unique persons aged 10 to 17 in youth detention at any time during the year.
Rates per 10,000 young people aged 10 to 17 in youth detention for Aboriginal and Torres Strait Islander young people and other Australian young people
| Jurisdiction | Rate for Aboriginal and Torres Strait Islander young people | Rate for other Australian young people | Ratio |
|---|---|---|---|
| Northern Territory | 336.6 | 7.1 | 47.6 |
| Australian Capital Territory | 330.1 | 21.8 | 15.1 |
| Western Australia | 240.5 | 10.4 | 23.1 |
| South Australia | 187.5 | 7.6 | 24.6 |
| Queensland | 142.2 | 6.7 | 21.4 |
| New South Wales | 122.8 | 7.9 | 15.6 |
| Tasmania | 40.6 | 10.9 | 3.7 |
| Victoria | 33.9 | 3.6 | 9.4 |
| Australia | 148.1 | 7.0 | 21.2 |
Source: Australian Institute of Health and Welfare, Youth Justice, supplementary tables S83b (2025).