Victoria’s imprisonment rate decreased by 10.3% over the last year, from 94.5 prisoners per 100,000 people in 2023 to 84.8 in 2024.
Victoria’s imprisonment rate in the early 1800s was estimated to have reached over 400 prisoners per 100,000 people. When more reliable figures became available in 1871, the imprisonment rate was close to half that estimate (210 prisoners per 100,000 people). By the mid–1970s, the imprisonment rate had declined substantially to below 50 prisoners per 100,000 people. It has, though, been more than 80 prisoners per 100,000 since 2008.
Note: The data in the graph measures the rate of prisoners per 100,000 people of all ages. It includes both sentenced and unsentenced prisoners.
Imprisonment rate per 100,000 people for Victoria
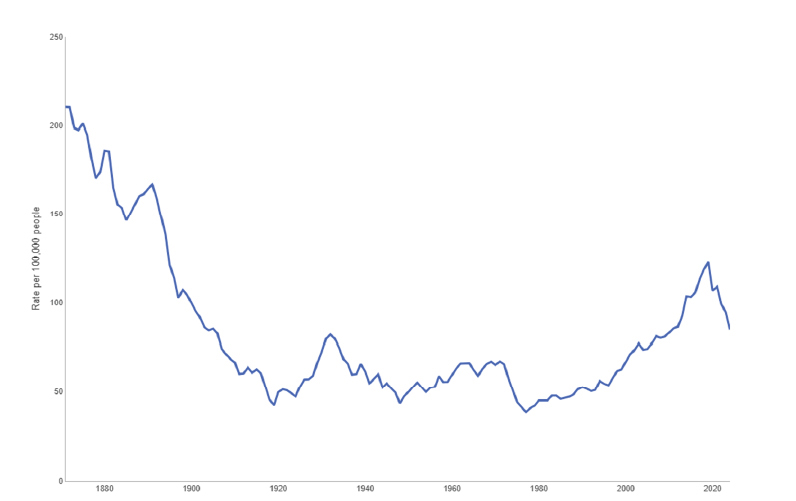
Sources: A. Freiberg and S. Ross, Sentencing Reform and Penal Change: The Victorian Experience (The Federation Press, 1999); Australian Bureau of Statistics, National, State and Territory Population (2024); Australian Bureau of Statistics, Prisoners in Australia (2024).
Note: Prison population data for 1872, 1899 and 1900 is missing in the original source. The values given are estimates. These estimates were divided by the Victorian population in the corresponding years, taken from Australian Bureau of Statistics, Historical Population (2016).